Ethereum Gas Fee Guide – Finding Low Prices
by playboygeezy
In this article, we are going to explore the gas price trend for Ethereum and explain why it is important to track the gas price. First, we want to explain how the gas price is determined and why gas is important in the Ethereum ecosystem. Then we will query the Anyblock ElasticSearch blockchain data API to obtain the desired information. Furthermore, we will examine if there are patterns in the gas price trend. The last section is covering the method and a short tutorial for obtaining and visualizing the data.
How is the Gas Price determined?
Every operation in the Ethereum ecosystem requires gas. This means that every transaction, every smart contract execution, every operation in which something is computed and/or written on the blockchain does cost gas. Ethereum gas is a unit that describes the amount of computational effort an operation requires. Gas quantifies the work the nodes in Ethereum do. The unit for gas is the smallest fraction of the currency ETHER (10¹⁸). Most of the time Gas is referred to as gwei (10⁹).
Essentially gas fees are compensations for the computational work which is needed for every transaction, smart contract execution, and deployment, and it is paid by the users which conduct the operation. The fee is awarded to miners, who verify the operations. The lower the user sets the gas price, the more likely the transaction will be ignored or takes a long time to process. Consequently, if you set the gas price high, you can “skip the queue” and your operation is verified faster.
The gas price depends on many factors. Such as the number of transactions, staking and investing in different tokens, and the amount of bytecode to process. Larger amounts of bytecode to process lead to higher transaction fees because more gas is consumed.
Why do we need to track the Gas Price?
Understanding the gas price fluctuation is necessary to determine the optimal point in time to submit a transaction, trigger or deploy a smart contract. Under extreme conditions, we can save a considerable amount of money (or time).
Therefore we are going to examine three different visualizations. First, we are going to analyze the daily gas prices for two years. We will try to find seasonal differences, analyze gas price spikes, and interpret how they emerged.
In the second visualization, the objective is to analyze the hourly gas price chart for the week of 5th October 2020 to 12th October 2020. In this chart, we will examine the hourly gas price differences and search for patterns between different days of the week. A possible pattern to find would be visible gas price differences between weekdays and weekends.
Last but not least we will examine the gas prices per minute for the past day. Here we hope to find daily patterns, which could save us money by submitting transactions at a point in time at which the gas price is low.
Gas Price Trends on Ethereum
Daily Gas Price
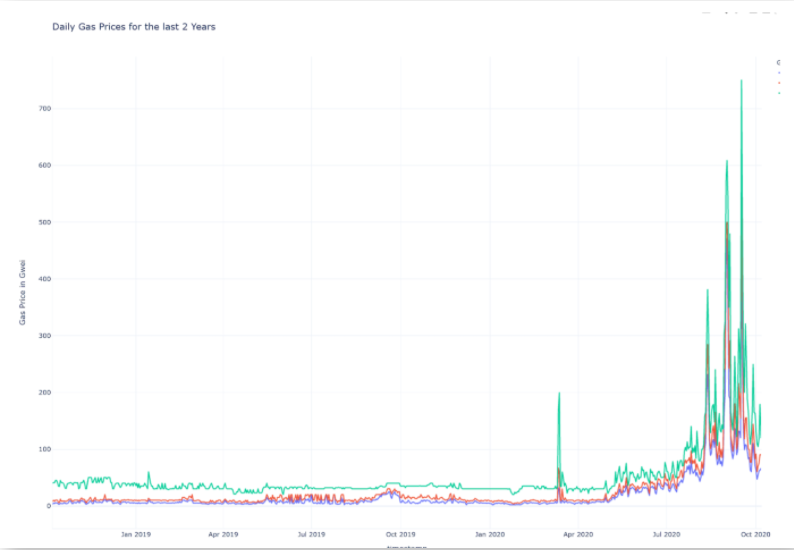
Let’s start with our first chart. In this chart, we see the daily gas price and the percentiles for a slow (30.0 Percentile), standard (60.0 Percentile), and fast (90.0 Percentile) transfer, highlighted in blue, red, and green. We plotted the daily prices for 2 years.
The first observation that stands out is that the gas price was fairly consistent up until March 2020. The gas price for a fast transfer was mostly between 30-40 gwei. Before March 2020 a standard transfer required fees of 10-20 gwei. The price difference between a slow and standard transfer was mostly irrelevant. After the March 2020 spike, an upwards trend began. The gas price exploded. In the timeframe between March and October 2020, the gas price rose to levels over 200 gwei. The fee for a fast transfer peaked at 750 gwei on September 17. A standard transfer on September 17 cost 561 gwei. Since September 17 we observe a downwards trend and the gas price reaches levels of 60-70 gwei.
Certain ideas try to explain the sudden surge of the gas price in March 2020 and the sharp upward trend of the gas price since July 2020. Some argue that the March 2020 spike was on one hand caused by the Coronavirus pandemic resulting in a sell-off activity, which triggered a black swan event and ultimately a stock- as well as crypto-market sell-off and this chain reaction’s interaction with DeFi lending position liquidations caused by the crypto-market sell-off on the other hand.
- The surge of new ETH addresses: From less than 10 million addresses which did hold ETH in Q1 to over 40 million in Q3 of 2020.
- Increasing network demand in ETH
- The rise in Decentralized Finance smart contracts
Yet some others argue that the Ethereum fee model is contributing to the surge in gas price and that Ethereum 2.0 will resolve some gas price issues by using a proof-of-stake algorithm.
The two-year chart shows no clear signs of seasonality effects. Conclusively it can be expected that the gas price will reach a constant level, albeit a higher level than before the gas price explosion.
Hourly Gas Price
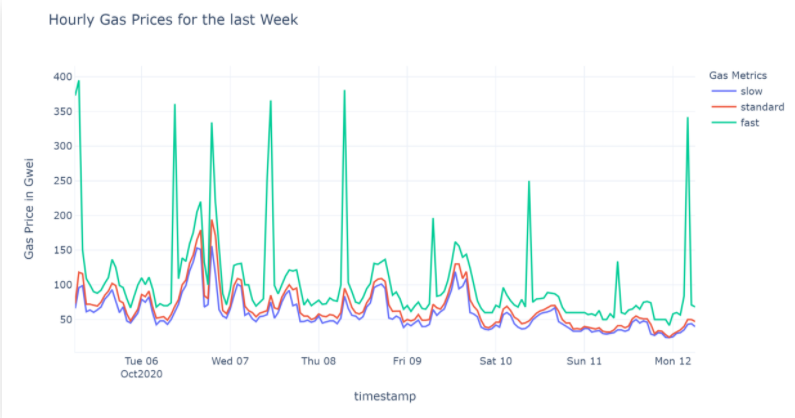
Now let’s move on to the second chart in this blog article. In this chart, we see the hourly gas price and the percentiles for a slow (30.0 Percentile), standard (60.0 Percentile), and fast (90.0 Percentile) transfer, highlighted in blue, red, and green. We plotted the hourly prices for 7 days.
There are a few different patterns we want to look into. First of all, we want to look at the gas price difference between weekdays and weekends. Observing the chart shows that the lowest hourly gas prices occur between Saturday and Monday. During Tuesday and Wednesday, as well as Friday and Saturday night the prices spike tremendously.
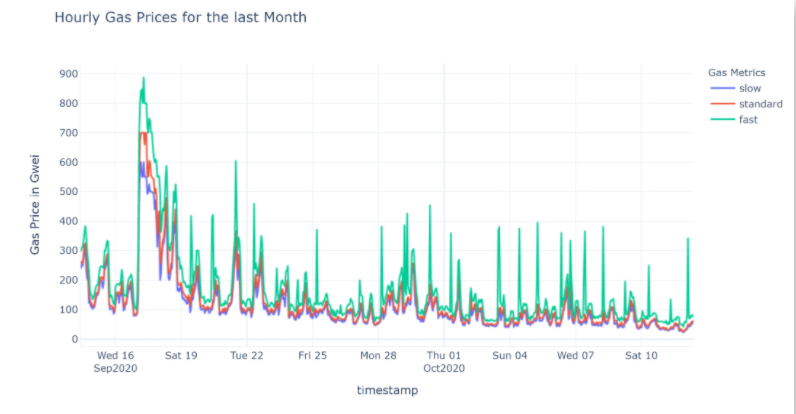
Now let us have a look at the price differences at various hours of the day. Could it be useful to submit transactions only at certain hours? For this analysis, we created a chart for the hourly gas prices for the past four weeks. Let’s see if we can spot hourly patterns:
Per Minute Gas Price
Now let’s move on to the third chart in this blog article. In this chart, we analyze the per minute gas price. We can observe the percentiles for a slow (30.0 Percentile), standard (60.0 Percentile), and fast (90.0 Percentile) transfer, highlighted in blue, red, and green. We plotted the per-minute prices for one day.
Are there any intraday patterns visible? Can we see the same early hours pattern as in the hourly past-day chart?
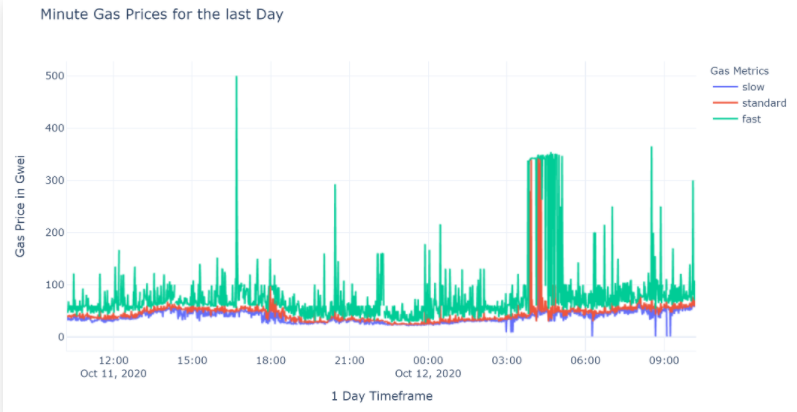
Again we can observe that the gas price spikes in the early morning hours. Furthermore, we see that the lowest gas price occurs between 9:00 and 12:00 pm UTC. If the transaction does not have to be carried out quickly, it is better to aim for 60%, because this value fluctuates less. And if there are surprisingly high prices, you can simply wait an hour, because they are probably much lower then. Noteworthy the per-minute price spiked a few times during the day, once even beyond 500 gwei.
Findings of Ethereum Gas Price Analytics
Let’s quickly summarize what we observed from the daily, hourly, and per minute charts. We would like to emphasize that these findings can’t be generalized. The gas price depends upon many factors and releases of new tokens or black swan events might, or rather most likely will, destroy these patterns.
- Large-scale events will drive gas prices up (token releases, black swan events…).
- There is evidence towards higher gas prices. This might be related to the general adoption of Ethereum for DeFi.
- Gas prices are higher on weekdays than on weekends.
- Transactions are more expensive in the morning than in the evening or night. The gas price spikes daily between 5.00 and 11.00 am UTC.
Conclusion
Thanks for taking the time to read this article. I hope that you could get some interesting insights into Ethereum gas prices. In this article, we learned to work with the Anyblock API, got some insights into the gas price trends and patterns, and acquired some knowledge about the best point in time to issue a transaction.

Recent Comments