World of Warplanes Joysticks Axes Graphs Guide
World of Warplanes Joysticks Axes Graphs Guide by DrSinister
Here is a crash course of using the new axes graphs to adjust for sensitivity/precision and getting the joystick properly setup for the game.
Note: I will be showing how to adjust the axes via the yaw axis because this is the only axes I have still linear.
Basic Overview of the Joystick Settings
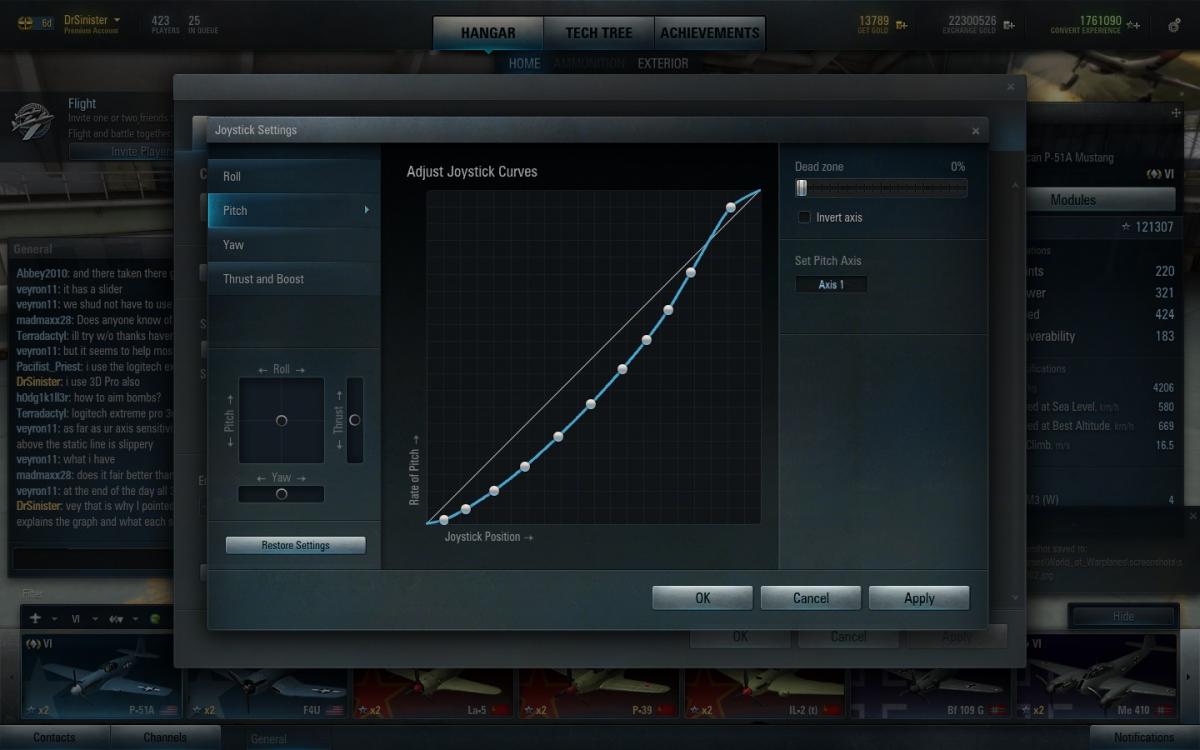
First thing you need to press ESC, click settings and change the control scheme to Joystick. (if yours is bugged and shows all joystick or another control scheme, then select through them till the Adjust Joystick Axes button appears.) Now press the Adjust Joystick Axes button (button encase in red in picture.)
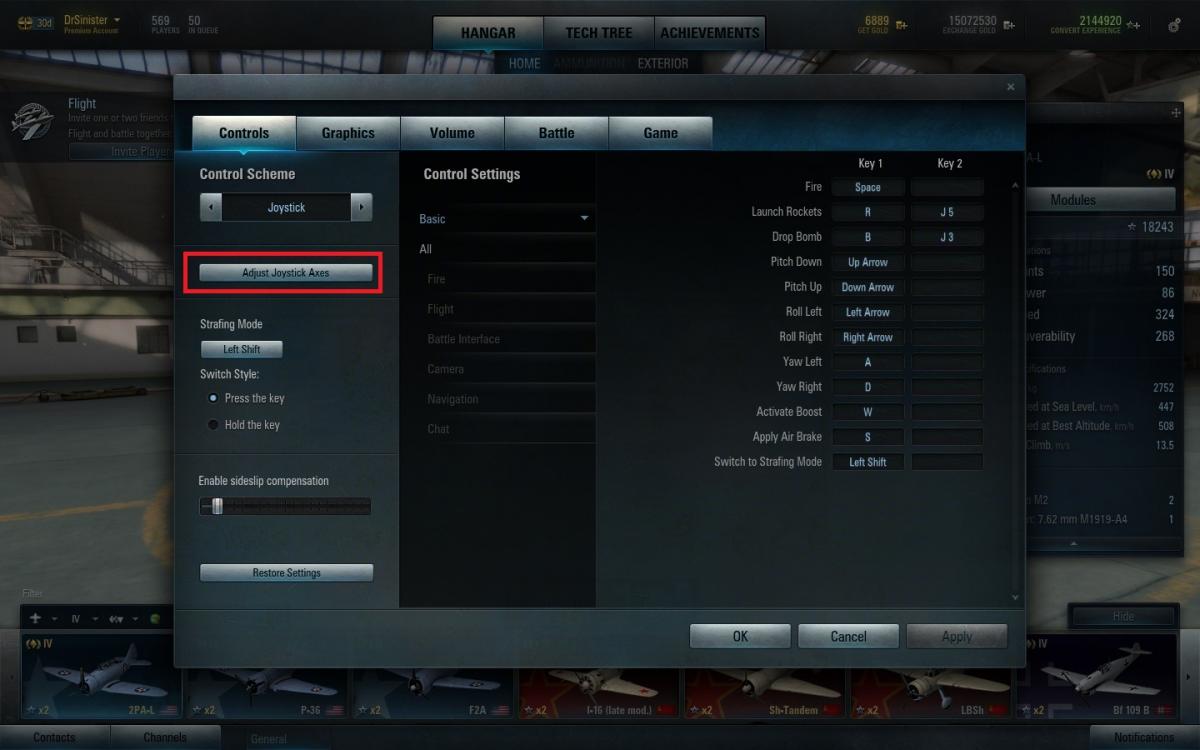
This will bring up the Axes graphs, each axis has its own graph, Roll, Pitch, Yaw, Thrust and Boost (green section), how the game reads your stick (orange section), deadzone and invert axis (red section), and what axis to set for each axis in game (blue section).

Make sure that the orange section reads your joystick all centered, if this is not the case, then exit the game and re-calibrate it via Windows Game Controller screen. (Google this if you can not find it for your Operating System.)
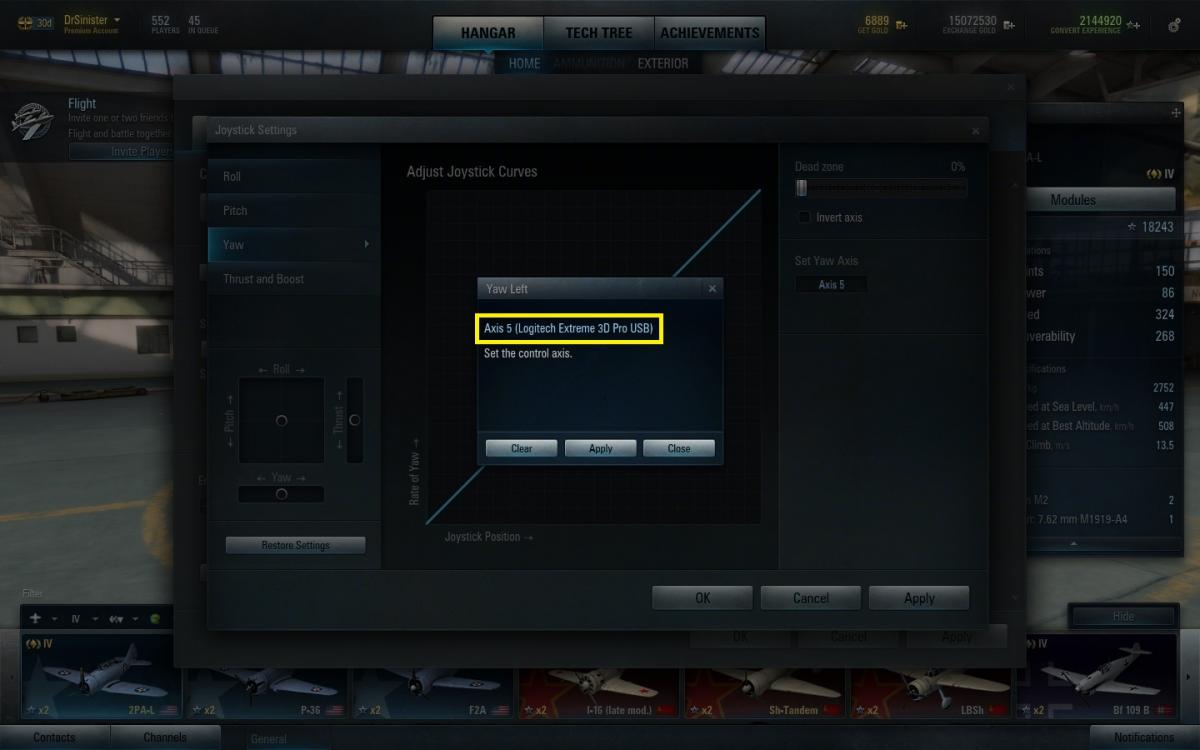
Now for each Axes on the left, make sure that each one has the proper axis assigned to your joystick (blue section). Also make sure that it is not set as Axis # (Default Controller), inside the ( ) should have your Joystick Name, like it does for my Extreme 3D Pro in the yellow section of the picture.
You will also notice that there is no sensitivity slider anymore. this is done via the graph.
How to read the Graph
This is what the graph looks line in default state:
The bottom of the graph (horizontal plane or the yellow line) is the representation of the physical joystick positions (or %). Each graph line represents 5 points in a scale of 0-100 points.
The left side of the graph (vertical plane or the orange line) is the representation rate of roll, pitch, or yaw (or %). Each graph line represents 5 points in a scale of 0-100 points.
Setting up the Curves
Each graph has 8 movable points, green section, you can add (left clicking anywhere on the graph) or remove (right clicking the point) from the graph and 2 stationary points (0 and 100 and are not displayed). Note: In default state only 1 point is displayed.
In a default state, the graphs shows a 45 degree line from 0 to 100. This is also known as a Linear curve. What this represents is that all points are 1:1. For example, if my joystick is at 50% axis then the game will roll, yaw or pitch the plane 50%.
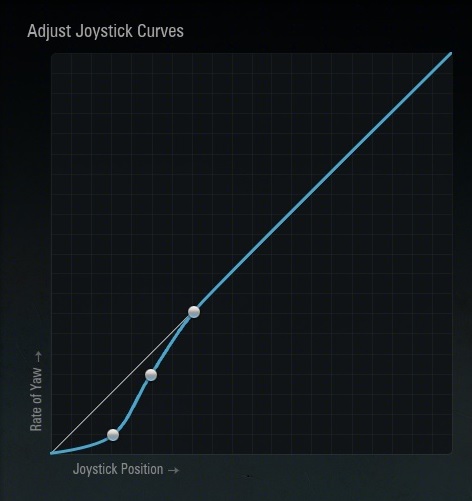
Now with the picture above you will see a non-linear curve. I have plotted 3 points, 15%, 25% and 35% of the Joystick Position, also these points are at the 5%, 20% and 35% of the Rate of Pitch, Roll, Yaw.
What does this mean? Well, what it means is that when my joystick is at 15% of the axis the game will represent the rate of pitch, roll, or yaw at 5%, at 25% joystick axis at 20% and at 35% joystick axis at 35%. This also will lower the sensitivity of my joystick at these said points because they are not outputting the same % as what my joystick is positioned at.
Basically how you will look at the graph is anything below the 45 degree line will lower the sensitivity and anything above the 45 degree line will raise the sensitivity.
Also you will be doing a lot of tweaking of the graph at this stage till you can find a curve that will work for you.
Examples
The picture below will show how I lowered the rate by 5%, which is pretty much still a linear curve just adjusted lower.
What this curve below achieves is that from 0 to 35% it reduces the sensitivity of the rate of pitch, roll, or yaw near the center of the joystick, this also will allow more precision tuning of the plane at the center of the joystick. Then after 35% its the same linear 1:1 curve for the remainder of the joystick positions.
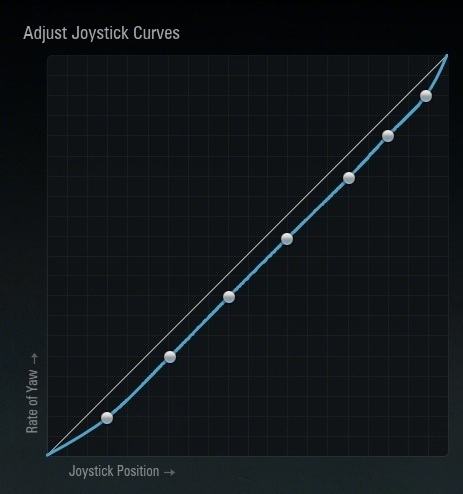
Now my curve that I use looks like this:
(do not look at the additional points that I have in my curve, this is advanced modding of the xml to get more then the 8 points to adjust, I am just using my curve itself as an example)
This is my old curve.
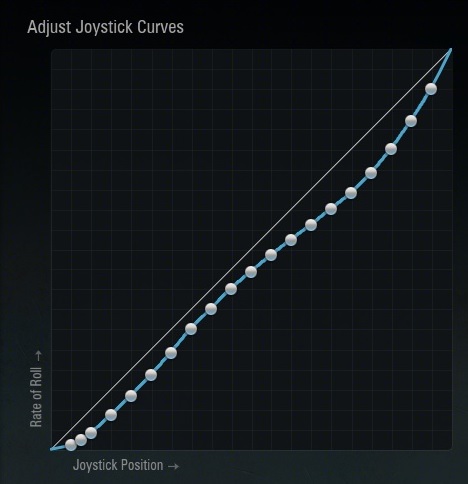
This curves overall has a slight lower sensitivity. In the center of my joystick its lowered to where I feel I have the best fine tuning for me then it rolls back up in sensitivity around 30-50% of my joystick then it rolls down in sensitivity again after 50% to about 99% to give me even more fine tuning at this point (this would be used more in a turn fight because this is roughly where my joystick is when I am lining up a shot) then at 100% stick it gives me the full rate of pitch or roll.
My new curve as of 4/17/13, both pitch and roll are different curves now:


Recent Comments